4034305
Description

Flashcards by meg willmington, updated more than 1 year ago
|
|
Created by meg willmington
about 9 years ago
|
|
| Question | Answer |
| Area of square | L2 |
| Area of rectangle | l x w |
| Area of parallelogram | b x h |
| Area of trapezium | (a + b) h/ 2 |
| Area of triangle | b x h/ 2 |
| Area of circle | |
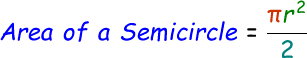
| Area of semicircle | |
| Area of fraction of circle | x/360 x pi r2 |
| Formula for surface area | - Draw the net of shape - Label all the shapes - Formula - Substitute - Therefore sentence SA (cube) = 6 x A(formula) |
| Area of cylinder | 2 x pi x r2 x h |
| Calculating volume | V = A(base) x h |
| Qualitative Data | Categorical Ordinal |
| Quantitative Data | Discrete Continuous |
| Category of data that has no sense of order | Catagorical |
| Category of data that has a sense of order | Ordinal |
| Clearly distinct values; count | Discrete |
| Any value in a range is possible; measure | Continuous |
| Census | Data set is from the entire population |
| Survey | Data set is from a portion of the population |
| Grouped data Class mid-point | = lower class value + upper class value/ 2 |
| Frequency | The amount of times a certain class has been tallied |
| Mean | = Efx/ Ef |
| Continuous grouped data (class mid-point) | lower class value + upper class value/ 2 |
| Stem and leaf plot Mean formula | Ex/ n |
| Stem and leaf plot Median formula | (n + 1)/ 2 |
| Mode | There can be no more than two modes (make sure to state what are the modes) |
| Range | Largest value - smallest value |
Want to create your own Flashcards for free with GoConqr? Learn more.