38105660
Question 1
Question
What is the difference between a 2-factor CRD and a 1-way CRD?
Answer
-
2-factor CRD allows for simultaneous testing of 2 treatment effects in the same experiment
-
1-factor CRD allows for simultaneous testing of 2 treatment effects in the same experiment
-
2-factor CRD tests the average of 2 Mu's for each Eu
-
1-factor CRD tests the average of 2 Mu's for each EU
Question 2
Question
Can you add nesting or blocking to a 2-factor CRD?
Answer
-
Yes
-
No
Question 3
Question
What are some of the advantages to using a 2-way CRD?
Answer
-
Can use fewer resources
-
Can gain efficiency in testing single factors
-
Allows you to test for interaction
-
Decreases the number of levels in each factor analysis
Question 4
Question
What are some of the drawbacks of using a 2-factor CRD?
Answer
-
Becomes more difficult to do based on practical limitation
-
Uses more resources
-
Loses efficiency in testing single factors
-
Can't test for interaction
Question 5
Question
What are the assumptions of a 2-factor CRD?
Answer
-
Independence within cells
-
Randomly Drawn Individuals within cells
-
Variances of the cells are similar
-
Normality within the cells
-
Additivity within the cells
-
Multiplicity of the cells
-
Normality of measurement units
-
Independence of measurement units
-
HOV of measurement units
Question 6
Question
What are the assumptions of a 3-factor CRD?
Answer
-
Independence within cells
-
Randomly Drawn Individuals in cells
-
Variances of cells are similar
-
Normality within the cells
-
Additivity within the cells
-
Multiplicity within the cells
-
Normality of measurement units
-
Independence of measurement units
-
HOV of measurement units
Question 7
Question
Each combination of the two factors applied at the same time is a [blank_start]cell[blank_end] containing [blank_start]experimental units[blank_end].
Answer
-
cell
-
pillar
-
block
-
experimental units
-
measurement units
Question 8
Question
If each cell in a two-factor CRD only contains one experimental unit, the calculations are the same as a [blank_start]Randomized Block ANOVA[blank_end], even though the designs are different.
Answer
-
Randomized Block ANOVA
-
Repeated Time Measure ANOVA
-
One-Way ANOVA
Question 9
Question
This is an example of a/an [blank_start]Proportional[blank_end] [blank_start]Balanced[blank_end] design. In this design, [blank_start]n-cells are the same in all cells[blank_end] and tests of cells on diagonal [blank_start]are ok[blank_end].
Answer
-
Proportional
-
Disproportional
-
Balanced
-
Unbalanced
-
n-cells are the same in all cells
-
ratios of n-cells are the same
-
ratios of n-cells are not the same
-
are ok
-
fail
Question 10
Question
This is an example of a/an [blank_start]Proportional[blank_end] [blank_start]Unbalanced[blank_end] design. In this design, [blank_start]n-cells are the same in all cells[blank_end] and tests of cells on diagonal [blank_start]are ok[blank_end].
Answer
-
Proportional
-
Disproportional
-
Unbalanced
-
Balanced
-
n-cells are the same in all cells
-
ratios of n-cells are the same
-
ratios of n-cells are not the same
-
are ok
-
fails
Question 11
Question
This is an example of a/an [blank_start]Proportional[blank_end] [blank_start]Balanced[blank_end] design. In this design, [blank_start]n-cells are the same in all cells[blank_end] and tests of cells on diagonal [blank_start]are ok[blank_end].
Answer
-
Proportional
-
Disproportional
-
Balanced
-
Unbalanced
-
n-cells are the same in all cells
-
ratios of n-cells are not the same
-
ratios of n-cells are the same
-
are ok
-
fail
Question 12
Question
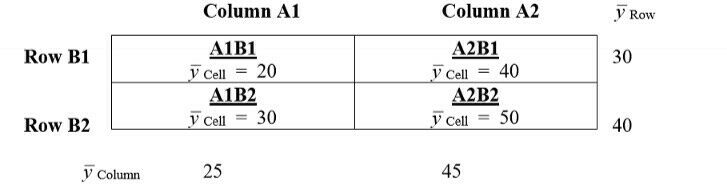
This is the results of an example Two-Factor CRD ANOVA with Multiple Replicates.
What kind of interaction is this? [blank_start]No Interaction[blank_end]
Can we interpret Main Effects? [blank_start]Yes[blank_end]
Would Simple Effects be of interest? [blank_start]Possibly[blank_end]
Answer
-
No Interaction
-
Interaction due to Multiplicative Data
-
Interaction due to biological process
-
Yes
-
No
-
Possibly
-
Definitely
-
Likely not
-
Yes, after a ln transformation
-
One might
Question 13
Question
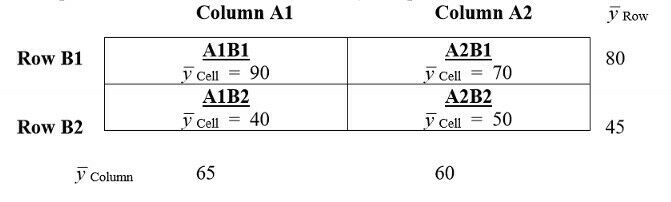
This is the results of an example Two-Factor CRD ANOVA with Multiple Replicates.
What kind of interaction is this? [blank_start]No Interaction[blank_end]
Can we interpret Main Effects? [blank_start]Yes[blank_end]
Would Simple Effects be of interest? [blank_start]Possibly[blank_end]
Answer
-
No Interaction
-
Interaction due to Multiplicative Data
-
Interaction due to biological process
-
Yes
-
No
-
Possibly
-
Definitely
-
Likely not
-
Yes, after a ln transformation
-
One might
Question 14
Question
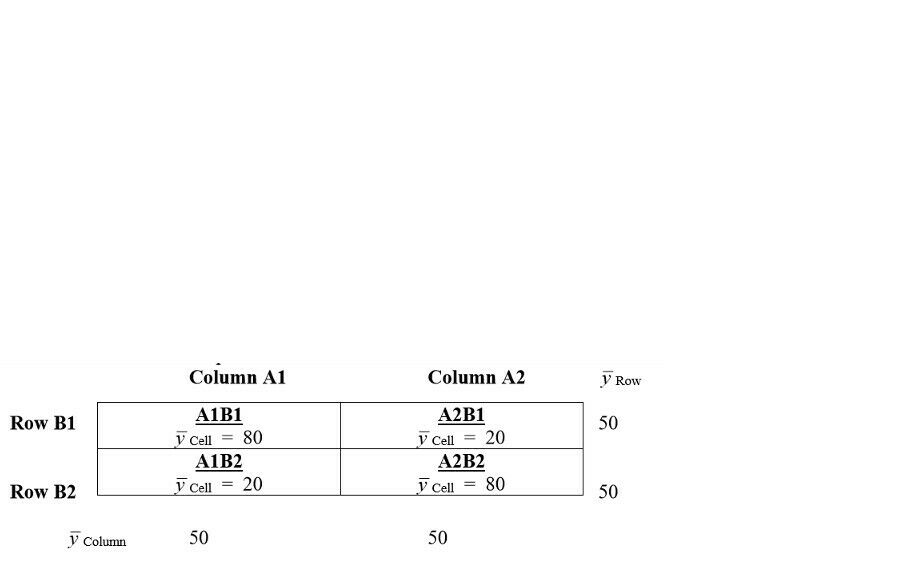
This is the results of an example Two-Factor CRD ANOVA with Multiple Replicates.
What kind of interaction is this? [blank_start]No Interaction[blank_end]
Can we interpret Main Effects? [blank_start]Yes[blank_end]
Would Simple Effects be of interest? [blank_start]Possibly[blank_end]
Answer
-
No Interaction
-
Interaction due to Multiplicative Data
-
Interaction due to biological process
-
Yes
-
No
-
Possibly
-
Definitely
-
Likely not
-
Yes, after a ln transformation
-
One might
Question 15
Question
This is the results of an example Two-Factor CRD ANOVA with Multiple Replicates.
What kind of interaction is this? [blank_start]No Interaction[blank_end]
Can we interpret Main Effects? [blank_start]Yes[blank_end]
Would Simple Effects be of interest? [blank_start]Possibly[blank_end]
Answer
-
No Interaction
-
Interaction due to Multiplicative Data
-
Interaction due to biological process
-
Yes
-
No
-
Possibly
-
Definitely
-
Likely not
-
Yes, after a ln transformation
-
One might
Question 16
Answer
-
No Interaction
-
Original Multiplicative Data
-
Multiplicative data with transformation
-
Some interaction
-
Interaction
Question 17
Question
Simple effects or cell means testing is usually done with the interaction effect in the Two-Factor ANOVA is _______, and interpreting main effects of column and row means does not make sense.
Answer
-
large
-
small
Question 18
Question
Sevearal different approaches can be used to examine simple effects. The primary differences in the approaches deal with control of ____________ and ____________ considerations
Answer
-
multiplicity
-
power
-
p-value
-
additivity
Question 19
Question
What "logical" sets of simple effects exist?
Answer
-
within columns
-
within rows
-
within columns and rows
-
diagonal
Question 20
Question
In a Two-Factor ANOVA, if interaction is large and it has been decided that the main effects cannoth be interpreted, can we ignore the two-factor design and analyze each column/row with separate One-Factor Completely Randomized ANOVAs?
Answer
-
Yes
-
No
Question 21
Question
Is ignoring the two-factor design and running separate One-Factor ANOVAs or t-tests more or less powerfal than constructing the simple effects tests ithin the context of the Towo-Factor ANOVA? Why?
Answer
-
Less powerful, because MS-Error and df-Error from all groups are used in the calculation for each pair.
-
Less powerful, because df increases with each One-Factor test
-
More powerful, because MS-Error and df-Error from all groups are used in the calculation for each pair.
-
More powerful, because df increases with each One-Factor test
Question 22
Question
Model I: [blank_start]fixed - 2 fixed factors[blank_end]
Model II: random - [blank_start]2 random factors[blank_end]
Model III: mixed - [blank_start]1 fixed factor, 1 random factor[blank_end]
Answer
-
fixed - 2 fixed factors
-
2 random factors
-
1 fixed factor, 1 random factor
Question 23
Question
Testing for interaction is...
Answer
-
similar change in magnitude and direction acoss treatment factor combinations
-
similar p-values in separate One-Factor ANOVA analyses
Question 24
Question
What are the null hypotheses of a Two-Factor Completely Randomized ANOVA with Multiple Replicates? (hint: main effects)
Answer
-
Column means are the same
-
Row means are the same
-
Interaction is not present
-
Cell means are the same
-
Interaction is present
Question 25
Question
What are the assumptions of a Two-Way Completely Randomized ANOVA (Model I) with Multiple Replicates?
Answer
-
data points within each cell are from randomly drawn individuals, normally distributed, and independent of one another
-
the variances of the cells are similar
-
data is additive
-
data points within the experiment are from randomly drawn individuals, normally distributed, and independent of one another
-
HOV within the experiment
-
data is multiplicative
Question 26
Question
What steps should be taken after the main Two-Way ANOVA?
Answer
-
Multiple Comparisons of main effects: testing for pair-wise differences between column/row means
-
Simple effects: testing for pair-wise differences in cell means within each column/row
-
Multiple Comparisons of main effects: testing for pair-wise differences within each column/row means
-
Simple effects: testing for pair-wise differences in cell means between columns/rows
Question 27
Question
Select all that apply to Type I SS
Answer
-
also known as "sequential SS"
-
valid only for balanced replication
-
Designed by Fisher
-
First SS developed
-
Can be used for balanced and disproportionate replication
-
takes interaction into account
-
often defaulted to because it works with almost every replication type
-
Yate's "unadjusted method of fitting constants"
-
Yate's "adjusted method of fitting constants"
-
Yate's "weighted squares of means"
Question 28
Question
Select all that apply to Type II SS
Answer
-
also known as "sequential SS"
-
valid only for balanced replication
-
Designed by Fisher
-
Can be used for balanced and disproportionate replication
-
more powerful than Type III with no interaction
-
takes interaction into account
-
often defaulted to because it works with almost every replication type
-
Yate's "unadjusted method of fitting constants"
-
Yate's "adjusted method of fitting constants"
-
Yate's "weighted squares of means"
Question 29
Question
Select all that apply to Type III SS
Answer
-
also known as "sequential SS"
-
valid only for balanced replication
-
Designed by Fisher
-
First SS developed
-
Can be used for balanced and disproportionate replication
-
takes interaction into account
-
often defaulted to because it works with almost every replication type
-
Yate's "weighted squares of means"
-
Yate's "unadjusted method of fitting constants"
-
Yate's "adjusted method of fitting constants"
Question 30
Question
With balanced data, all SS methods (Type I, II, III) will yield the same results.
Answer
- True
- False
Question 31
Question
SS will be the same for two entries in all computation methods (Type I, II, III). Which two?
Answer
-
error (residual)
-
interaction
-
Factor A
-
Factor B
-
total
Question 32
Question
In the presence of significant interaction, the chosen method of SS is _________.
Answer
-
irrelevant
-
crucial
-
somewhat important
Question 33
Question
Which of these are ways to DIRECTLY interpret interaction in a Two-Factor ANOVA?
Answer
-
interaction contrasts
-
simple effects
-
correlation
-
regression
-
sum of squares
Question 34
Question
Main effects for Factor A by this method can be interpreted as the main effect of Factor a controling or adjusting for Factor B and the interaction of Factor A x Factor B.
Answer
-
Type I SS
-
Type II SS
-
Type III SS
Question 35
Question
A major criticisim of this method is that the model does not respect marginality, and that it is generally wrong to interpretmain effects in the presence of an interaction.
Answer
-
Type I SS
-
Type II SS
-
Type III SS
Question 36
Question
In this method, SS for main effects are computed adjusting fo other main effects in the model, but omitting interaction terms.
Answer
-
Type I SS
-
Type II SS
-
Type III SS
Question 37
Question
In this method of SS computation, effects are adjusted only for the terms that appear "above" them in the ANOVA table.
Answer
-
Type I SS
-
Type II SS
-
Type III SS
Question 38
Question
A criticism of this SS computation method is that it produces different values for SS if we swap the ordering of the factors.
Answer
-
Type I SS
-
Type II SS
-
Type III SS
Question 39
Question
The null hypothesses associated with this method can be interpreted as the equcivalenc eof unweighted means without making further assumptions regarding the presence of interaction.
Answer
-
Type I SS
-
Type II SS
-
Type III SS
Question 40
Question
This method simplifies the testing of equality of equally weighted means if the interaction term is assumed to be zero.
Answer
-
Type I SS
-
Type II SS
-
Type III SS
Question 41
Question
If we can assume there's no interaction, the hypotheses for the Type I method become equivalent to Type III
Answer
- True
- False
Question 42
Question
This method tests for equivalence of fully weighted means for the first variable entered into the model, and the null hypothesis for the second factor is the same as the Type II method.
Answer
-
Type I
-
Type III
Question 43
Question
A criticisim for these methods of SS computation is that the null hypotheses are a function of sample size.
Answer
-
Type I
-
Type II
-
Type III
Question 44
Question
If ther is no interaction, this SS computation mehtod is the most powerful for an unbalanced design.
Answer
-
Type I
-
Type II
-
Type III
Question 45
Question
For most situations, power of the method of SS computation depends primarily on what?
Answer
-
structure of the imbalance
-
sample size
-
model type
Question 46
Question
Procedure for Aligned Rank Transform for a Two-Factor ANOVA
1. [blank_start]Align[blank_end] data [blank_start]seperately[blank_end] producing [blank_start]three[blank_end] different data sets
2. [blank_start]Rank aligned[blank_end] data [blank_start]all together[blank_end] [blank_start]within[blank_end] each of the [blank_start]three[blank_end] data sets
3. Replace original data with [blank_start]ranks[blank_end] [blank_start]within[blank_end] each of the [blank_start]three[blank_end] data sets
4. Run [blank_start]three[blank_end] [blank_start]separate[blank_end] [blank_start]Two-Factor[blank_end] ANOVAs on [blank_start]ranks[blank_end]
Answer
-
Align
-
Rank
-
Average
-
seperately
-
al together
-
three
-
five
-
seven
-
one
-
Rank aligned
-
Align ranked
-
Average ranked
-
Average aligned
-
Align averaged
-
Rank averaged
-
all together
-
seperately
-
within
-
between
-
three
-
one
-
five
-
seven
-
ranks
-
average
-
alignments
-
within
-
between
-
three
-
one
-
five
-
seven
-
three
-
one
-
five
-
seven
-
separate
-
combined
-
Two-Factor
-
One-Factor
-
Three-Factor
-
ranks
-
averages
-
alignments
Question 47
Question
A _______ is another version of a two-factor experiment, with one factor nesed within the second factor.
Answer
-
Split-Plot design
-
Nested design
-
Repeated Measures design
-
Blocked design
Question 48
Answer
-
Two-Way CRD
-
Split-Plot design
-
One-Factor Nested design
-
Repeated Measures
Question 49
Question
Procedure for Aligned Rank Transform for a Three-Factor ANOVA
1. [blank_start]Align[blank_end] data [blank_start]seperately[blank_end] producing [blank_start]three[blank_end] different data sets
2. [blank_start]Rank aligned[blank_end] data [blank_start]all together[blank_end] [blank_start]within[blank_end] each of the [blank_start]three[blank_end] data sets
3. Replace original data with [blank_start]ranks[blank_end] [blank_start]within[blank_end] each of the [blank_start]three[blank_end] data sets
4. Run [blank_start]three[blank_end] [blank_start]separate[blank_end] [blank_start]Two-Factor[blank_end] ANOVAs on [blank_start]ranks[blank_end]
Answer
-
Align
-
Rank
-
Average
-
seperately
-
all together
-
three
-
one
-
five
-
seven
-
Rank aligned
-
Align ranked
-
Rank averaged
-
Align averaged
-
Average ranked
-
Average aligned
-
all together
-
separately
-
within
-
between
-
three
-
one
-
five
-
seven
-
ranks
-
averages
-
alignments
-
within
-
between
-
three
-
seven
-
three
-
one
-
five
-
seven
-
separate
-
combined
-
Two-Factor
-
One-Factor
-
Three-Factor
-
ranks
-
averages
-
alignments
-
five
-
one
Question 50
Question
_____________ is a common technique for estimating coefficients of linear regression equations.
Answer
-
Ordinary Least Squares (OLS)
-
Geometric Mean Axis (GMA)
-
Pearson Correlation Analysis
-
ANVOA
-
ANCOVA
Question 51
Question
Linear regrassion equations describe the relationship beetween one or more [blank_start]independent[blank_end] [blank_start]quantitative[blank_end] variables and a [blank_start]dependent[blank_end] variable.
Answer
-
independent
-
dependent
-
quantitative
-
qualitative
-
dependent
-
independent
Question 52
Question
What are the purposes of OLS?
(One-Factor ANOVA with x as independent variable and y as dependent variable)
Answer
-
Quatify rate of change in y as x changes
-
Quantify value of y at x=0 (y-intercept)
-
Predict a y-value given x
-
Quantify rate of change in x as y changes
-
Predict an x-value given y
-
Quantify a value of x at y=0 (x-intercept)
Question 53
Question
In which situations can OLS be used?
Answer
-
straight lines
-
curved lines that can be transformed into straight lines
-
quadratic lines
-
cubic lines
-
s-shaped lines
Question 54
Question
OLS assumes error in...
Answer
-
only the y-direction
-
only the x-direction
-
in both the x and y direction
Question 55
Question
Which line is the middle line of the data (Error in both the x and y direction)?
Answer
-
Central Axis Line
-
Geometric Mean Axis (GMA)
-
Reduced Major Axis
-
Ordinary Least Squares (OLS) Line
Question 56
Question
The OLS method aims to minimize the [blank_start]sum of squre differences[blank_end] between the observed and predicted values.
Answer
-
sum of sqaure differences
-
sum of differences
-
average difference
-
average error
-
sum of error terms
Question 57
Question
The main question that OLS aims to answer is whether or not there is a treatment effect (presence or absence of change).
Answer
- True
- False
Question 58
Question
[blank_start]Prediction Intervals[blank_end]: related to individual points in a dataset that was predicted mathematically.
[blank_start]Prediction Bands[blank_end]: related to the entire OLS line from the new dataset that was predicted mathematically
[blank_start]Confidence Intervals[blank_end]: related to individual points in the actual dataset
[blank_start]Confidence Bands[blank_end]: related to the entire OLS line from the new dataset that was predicted mathematically
Answer
-
Prediction Intervals
-
Prediction Bands
-
Confidence Intervals
-
Confidence Bands
Question 59
Question
Steps of inverse prediction:
1. Measure the [blank_start]dependent[blank_end] variable ([blank_start]y[blank_end]) at known values of the [blank_start]independent[blank_end] variable ([blank_start]x[blank_end]).
2. Use these values to create a [blank_start]standard curve[blank_end] and find the regression equation
3. Rearrange the regression, isolating [blank_start]x[blank_end] on one side
4. Measure the unknown, finding the [blank_start]y-value[blank_end]
5. Plug the measurement into the rearranged equation to find the unknown value
Answer
-
dependent
-
independent
-
y
-
x
-
independent
-
dependent
-
x
-
y
-
standard curve
-
line of correlation
-
central axis
-
x
-
y
-
y-value
-
x-value
Question 60
Question
[blank_start]Interpolation[blank_end]: using the section of the OLS line bounded by the dataset for data prediction ([blank_start]good use of equation[blank_end])
[blank_start]Extrapolation[blank_end]: using sections of the OLS line not bounded by the dataset in order to complete data prediction ([blank_start]not recommended[blank_end])
Answer
-
Interpolation
-
Extrapolation
-
good use of equation
-
not recommended
-
Extrapolation
-
Interpolation
-
not recommended
-
good use of equation
Question 61
Question
Common Diagnostic Tests for OLS
[blank_start]Scatter Plot of Y vs X[blank_end]
-initial visual diagnostic
-may indicate [blank_start]non-linear patterns[blank_end]
r^2
-some information on the [blank_start]linear relationship between X and Y[blank_end]
-as a general rule, r^2 > [blank_start]0.95[blank_end] indicates a strong linear relationship
[blank_start]Durbin-Watson Test[blank_end]
-indication of [blank_start]autocorrelation[blank_end] or non-random error terms
-ranges from 0-4
- 2=[blank_start]low autocorrelation[blank_end], near 1 or 4 = [blank_start]high autocorrelation[blank_end]
[blank_start]Diagonal Elements of the hat matrix[blank_end]
-indication of X outlier
[blank_start]Studentized Residual[blank_end]
-examines patterns on scatter plot of Studentized Residual vs. X
-any pattern other than random indicates potential issues with [blank_start]linearity or HOV[blank_end]
[blank_start]Studentized Deletion REsidual[blank_end]
-large [blank_start]absolue alues[blank_end] indicate possible Y-outliers
-absolute SDR value in 2-3 range or greater indicate possible outlier
[blank_start]Cook's Distance[blank_end]
-large values indicate [blank_start]influential Y data point[blank_end] on linear equation
-percentiles greater than [blank_start]50[blank_end]% indicate overly influential data point. [blank_start]95[blank_end]% would be extreme.
Answer
-
Scatter Plot of Y vs X
-
non-linear patterns
-
linear relationship between X and Y
-
0.95
-
0.50
-
Durbin-Watson Test
-
autocorrelation
-
low autocorrelation
-
high autocorrelation
-
Diagonal Elements of the hat matrix
-
Studentized Residual
-
Studentized Deletion Residual
-
Cook's Distance
-
linearity or HOV
-
absolue values
-
percentiles
-
averages
-
influential Y data point
-
50
-
95
Question 62
Question
r^2 = [blank_start]1[blank_end] indicates a perfect line
r=[blank_start]1[blank_end] indicates perfect positive correlation
r=[blank_start]-1[blank_end] indicates perfect negative correlation
r=[blank_start]0[blank_end] indicates no correlation
Answer
-
1
-
1
-
-1
-
0
Question 63
Question
Transformation of X
--corrects non-linearity without changing [blank_start]variance[blank_end] and [blank_start]distribution of Y-values[blank_end]
Transformation of Y
--corrects non-linearity of [blank_start]relation between X and Y[blank_end]
--correct [blank_start]HOV[blank_end] and [blank_start]non-normal distribution of Y values[blank_end]
Transformation of both X and Y
--correct non-linearity [blank_start]imposed by transformations[blank_end] to fix other issues
Answer
-
distribution of Y-values
-
relation between X and Y
-
HOV
-
non-normal distribution of Y values
-
variance
-
imposed by transformations
Question 64
Question
[blank_start]Autoregressing Models[blank_end]
--regression taking [blank_start]autocorelation[blank_end] into account
--usually based on measuring things over time
[blank_start]Logistic Regression[blank_end]
--Regression of discrete categorical data ([blank_start]age, presence/absence[blank_end])
[blank_start]Curvilinear Regression[blank_end]
--fitting polynomial curves ([blank_start]cubic, quadratic, etc.[blank_end]
[blank_start]Nonlinear Regression[blank_end]
--fitting [blank_start]S-shaped curves[blank_end]
--commonly used for growth curves
[blank_start]Spline Regression[blank_end]
--using [blank_start]splines and knots[blank_end] to fit separate sections of complex patterns
--good for fit, not great for prediction
[blank_start]Multiple Regression[blank_end]
--similar to linear regression in many aspects, but more than one X variable
--uses [blank_start]dummy X matrix[blank_end]
Answer
-
Autoregressing Models
-
Logistic Regression
-
autocorelation
-
Curvilinear Regression
-
cubic, quadratic, etc.
-
S-shaped curves
-
Nonlinear Regression
-
age, presence/absence
-
Spline Regression
-
splines and knots
-
Multiple Regression
-
dummy X matrix
Question 65
Question
ANCOVA is a full design.
Answer
- True
- False
Question 66
Question
In ANCOVA, for each individual [blank_start]EU/MU[blank_end] [blank_start]a covariate[blank_end] is measured to account for variation other than the treatment effect.
Answer
-
EU/MU
-
block
-
factor
-
a covariate
-
an additional factor
-
an additional level
-
a block
Question 67
Question
ANCOVA can be applied to any design, including designs that also have blocking
Answer
- True
- False
Question 68
Question
ANCOVA is primarily utilized for what purpose?
Answer
-
remove background variation
-
add an additional level of analysis
-
order factors by importance
Question 69
Question
What is the null hypothesis of ANCOVA?
Answer
-
The adjusted means of columns are equal
-
The means of columns are equal
-
The observed frequency is equal to the expected frequency
-
The means of columns and rows are equal
-
There is no correlation between X and Y
Question 70
Question
What is the null hypothesis of Goodness of Fit?
Answer
-
The adjusted means of columns are equal
-
The means of columns are equal
-
The observed frequency is equal to the expected frequency
-
The means of columns and rows are equal
-
There is no correlation between X and Y
Question 71
Question
What is the null hypothesis of linear correlation?
Answer
-
The adjusted means of columns are equal
-
The means of columns are equal
-
The observed frequency is equal to the expected frequency
-
The means of columns and rows are equal
-
There is no correlation between X and Y
Question 72
Question
What are the assumptions for Y (data) for using a covariate in a One-Factor CRD?
Answer
-
Data points within each column are from randomly drawn individuals and are normaly distributed
-
Data points are independent of one another within and between columns
-
Variances of columns are similar
-
independent of treatment effect
-
no error in measuring
-
X and Y form a linear relationship for all treatment groups
-
slopes of regression lines are similar for all treatment groups
Question 73
Question
What are the assumptions for X (covariate) for using a covariate in a One-Factor CRD?
Answer
-
Data points within each column are from randomly drawn individuals and are normaly distributed
-
Data points are independent of one another within and between columns
-
Variances of columns are similar
-
independent of treatment effect
-
no error in measuring
-
X and Y form a linear relationship for all treatment groups
-
slopes of regression lines are similar for all treatment groups
Question 74
Question
What are the assumptions for X and Y for using a covariate in a One-Factor CRD?
Answer
-
Data points within each column are from randomly drawn individuals and are normaly distributed
-
Data points are independent of one another within and between columns
-
Variances of columns are similar
-
independent of treatment effect
-
no error in measuring
-
X and Y form a linear relationship for all treatment groups
-
slopes of regression lines are similar for all treatment groups
Question 75
Question
What is the main purpose for linear correlation?
Answer
-
Determine correlation of two measures.
-
Determine linear relationship between two measures
-
Remove background variation
Question 76
Question
What are the assumptions of Pearson's Correlation?
Answer
-
The X and Y pairs of data points are from randomly drawn individuals that are independent of one another
-
X and Y are normally distributed
-
X and Y form a linear relationship
-
HOV between data pairs
Question 77
Question
What are the assumptions of Spearman Non-Parametric Correlation?
Answer
-
The X and Y pairs of data points are from randomly drawn individuals that are independent of one another
-
X and Y are normally distributed
-
X and Y form a linear relationship
-
HOV between data pairs
Question 78
Question
[blank_start]r[blank_end] = Pearson correlation coefficient
[blank_start]r^2[blank_end] = coefficient of determination
Answer
-
r^2
-
r
Question 79
Question
[blank_start]OLS[blank_end] lines are used for prediction
[blank_start]Central Axis[blank_end] lines are used for function
Answer
-
OLS
-
Central Axis
Question 80
Question
In a t-test of the correlation coefficient, the null hypothesis is [blank_start]r = rho = 0[blank_end]. For a two-tailed test, t follows the [blank_start]t[blank_end]-distribution with v degrees of freedom.
Answer
-
r = rho = 0
-
r^2 = rho = 0
-
r = rho <> 0
-
r^2 = rho <> 0
-
r1 = r2
-
t
-
Durbin-Watson
-
r
-
x^2
-
G
Question 81
Question
z and z* transforms and the z-test of the correlation coefficient is used for testing which null hypotheses?
Answer
-
r = rho <> 0
-
r^2 = rho <> 0
-
r = rho = 0
-
r^2 = rho = 0
-
r1 = r2
-
basically, when the null hypothesis is that r is not equal to 0
-
basically, when the null hypothesis is that r is equal to 0
Question 82
Question
Which is one of the best non-parametric procedures for testing correlation?
Answer
-
Spearman
-
Pearson's
-
Durbin-Watson
-
Cook's Distance
Question 83
Question
The Spearman Non-Parametric procedures of determining correlation is often used by default because it doesn't rely on normality or linearity, but still gives reliable conclusions.
Answer
- True
- False
Question 84
Question
Analysis of Frequency/Count data relies on the testing of ___________ and ____________.
Answer
-
observed frequencies
-
expected frequencies
-
correlation coefficients
-
t-values
-
assigned values
Question 85
Question
What count-data design(s) can be analyzed with Goodness of Fit?
Answer
-
One-way
-
Two-way
-
Three-way
-
Four-way
Question 86
Question
What count-data design(s) can be analyzed with Contingency Tables?
Answer
-
One-way
-
Two-way
-
Three-way
-
Four-way
Question 87
Question
What is the null hypothesis for Goodness of Fit?
Answer
-
observed frequency = expected frequency
-
two-way classification factors are independent of each other
-
r = rho = 0
-
homogeneity across all tests
Question 88
Question
What is the null hypothesis for Contingency Tables?
Answer
-
observed frequency = expected frequency
-
two-way classification factors are independent of each other
-
r = rho = 0
-
homogeneity across all tests
Question 89
Question
What is the null hypothesis for Homogeneity Log-likelihood tests??
Answer
-
observed frequency = expected frequency
-
two-way classification factors are independent of each other
-
r = rho = 0
-
homogeneity across all tests
Question 90
Question
What are the assumptions for Goodness of Fit?
Answer
-
Counts are independent of each other
-
Expected frequencies are postulated before counts are made
-
Desireable to have a total count > 25
-
Desireable to have expected frequencies > 5
-
Desireable to have a total count > 6x the number of cells
-
Data is additive
-
Data is multiplicative
-
Counts are normally distributed
-
HOV
Question 91
Question
What are the assumptions for Contingency Tables?
Answer
-
Counts are independent of each other
-
Expected frequencies are postulated before counts are made
-
Desireable to have a total count > 25
-
Desireable to have expected frequencies > 5
-
Desireable to have a total count > 6x the number of cells
-
Data is additive
-
Data is multiplicative
-
Counts are normally distributed
-
HOV
Question 92
Question
Chi-squared test uses [blank_start]x^2[blank_end] statistic, which follows the [blank_start]x^2[blank_end] distribution table with v degrees of freedom.
Log-likelihood test uses the [blank_start]G[blank_end] statistic, which follows the [blank_start]x^2[blank_end] distribution table with v degrees of freedom.
Answer
-
x^2
-
t
-
G
-
D
-
x^2
-
t
-
G
-
D
-
z
-
z
-
G
-
x^2
-
t
-
D
-
z
-
x^2
-
G
-
D
-
t
-
z
Question 93
Question
Heterogeneitiy Log-Likelihood Tests analyze [blank_start]correlation[blank_end] by combining [blank_start]Goodness of Fit[blank_end] tests.
Answer
-
correlation
-
linear regression
-
Goodness of Fit
-
Contingency Table
-
ANOVA
-
ANCOVA
Question 94
Question
If the heterogeneity G test does not reject the null hypothesis of homogeneity across all tests, the [blank_start]Pooled G[blank_end] test is a legitimate test of adding the counts of all tests together for a combined test with a larger number of counts.
Answer
-
Pooled G
-
Chi-squared
-
Log-likelihood
-
Durbin-Watson
Question 95
Question
The purpose of this test is to add counts of multiple Godness-of-fit tests for a combined test with a larger number of counts.
Answer
-
Pooled G
-
Heterogeneity G
-
Goodness of Fit
-
Contingency Table
Question 96
Question
The purpose of this test is to test for homogeneity of goodness-of-fit tests (log-likelihood), particularly before a Pooled G test.
Answer
-
Pooled G
-
Heterogeneity G
-
Goodness of Fit
-
Contingency Table
Question 97
Question
Contingency tables can have marginal totals that are either fixed or not fixed.
[blank_start]Both fixed[blank_end] ([blank_start]very rare[blank_end])
Control totals of both factors, but not counts of each cell
In other words: control ratio between rows/columns, but not ratios of counts within each row/column
[blank_start]Both margins not fixed[blank_end] (common)
Don't control totals of each row/column, only the total N
In other words: don't control any ratios
[blank_start]One margin fixed, one margin not[blank_end] ([blank_start]common[blank_end])
Control totals of one facor (rows OR columns), but not the other.
In other words: control the ratio of either rows OR columns, but not the other.
Answer
-
One margin fixed, one margin not
-
Both margins not fixed
-
Both fixed
-
very rare
-
common
Want to create your own Quizzes for free with GoConqr? Learn more.