graficos estadisticos

Description

INFORMATICAII (3.5.1 graficos estadisticos) Quiz on graficos estadisticos, created by Jessica G on 15/09/2014.
Jessica G
Quiz by Jessica G, updated more than 1 year ago
Jessica G
Created by Jessica G over 9 years ago
24
0

Resource summary

Question 1

Question
los graficos estadisticos permiten presentar información cuantitativa.
Answer
  • True
  • False

Question 2

Question
los Tipos de gráficos estadísticos son:Barras-Líneas-Circulares
Answer
  • True
  • False

Question 3

Question
Los gráficos son los más convenientes para presentar datos
Answer
  • True
  • False

Question 4

Question
Los gráficos estadísticos presentan los datos en forma de dibujo?
Answer
  • True
  • False

Question 5

Question
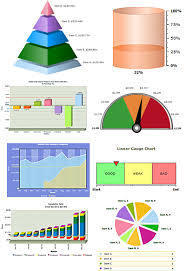
los graficos se emplean para tener una representación visual de la totalidad de la información?
Answer
  • True
  • False
Show full summary Hide full summary

Similar

CUADROS ESTADÍSTICOS
k_ariflores
ESTADÍSTICA: Gráficos
GABY MAXIMILA TORRES CABANILLAS
Key Events, People and Terms of the French Revolution
poppwalton
English Placement Test
CoachDanielDixon
Study Schedule- this week (1)
Lavinia Hayde
AQA GCSE Physics Unit 3 Mindmap
Gabi Germain
Computer science quiz
Ryan Barton
How Sewing Machines Work
faithkateridarli
Forces and motion
Catarina Borges
SFDC App Builder 1 (126-150)
Connie Woolard
Clinical Pathoanatomy MCQs (Q 151-250)
Ore iyanda