College Student Elementary Statistics Flashcards on Unit 1, created by Summer Davis on 21/01/2023.
Pinned to
3
0
0
No tags specified
|
|
Created by Summer Davis
almost 2 years ago
|
|
Close
|
|
Created by Summer Davis
almost 2 years ago
|
|

Statistics
What are the subjects/objects in a data table called?
What are the characteristics recorded for each case?
Cases are normally tracked using rows or columns?
Variables are normally tracked using rows or columns?
Categorical variable
Quantitative variable
Explanatory variable
Response variable
Population
Sample
Statistical inference
Sampling bias
How to avoid sampling bias?
Simple random sample
Bias
Association
Causation
Confounding variable
Observational study
Experiment
Randomized experiment
3 Explanations for why an association may be observed in sample data:
Treatments
Randomized comparative experiment
Matched pairs experiment
Control group
Placebo effect
Single-blind experiment
Double-blind experiment
Frequency table
Proportion
What kind of chart is this?

What kind of chart is this?
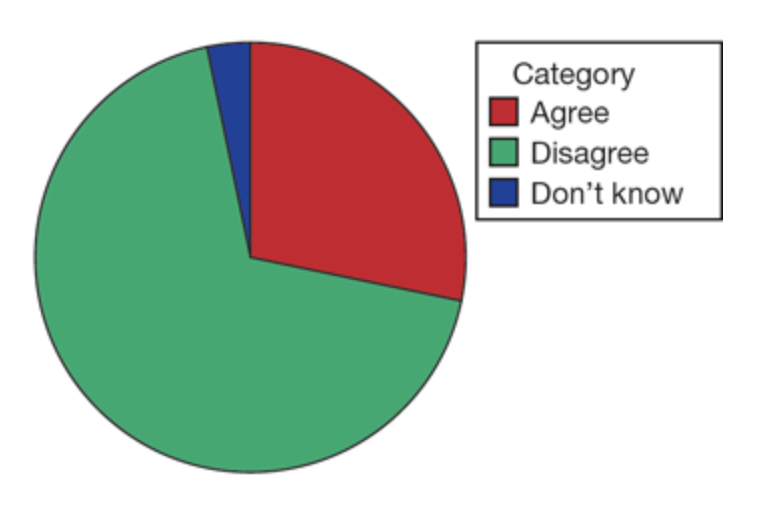
Notation for Proportion
Two-Way Table
What kind of chart is this?
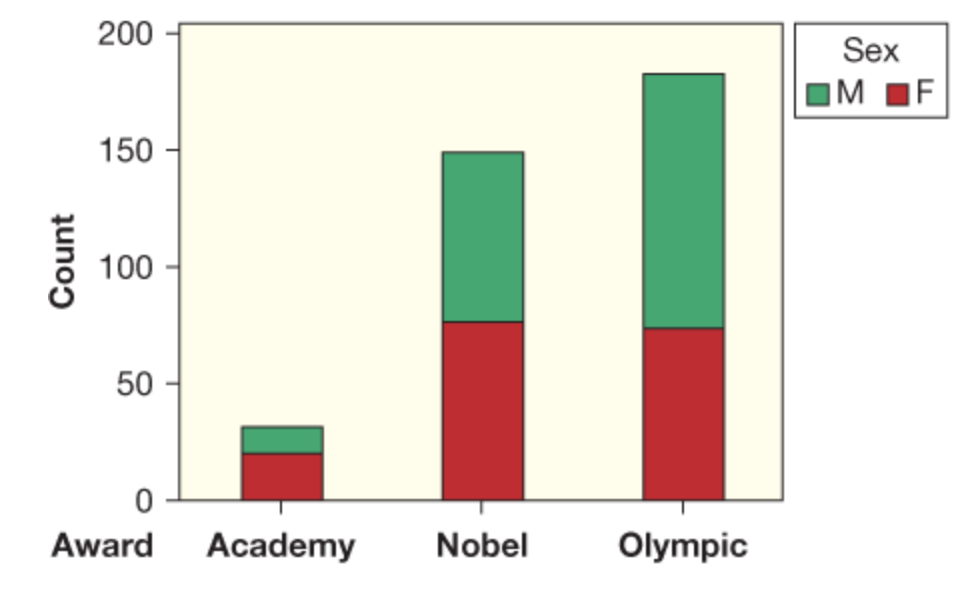
What kind of chart is this?
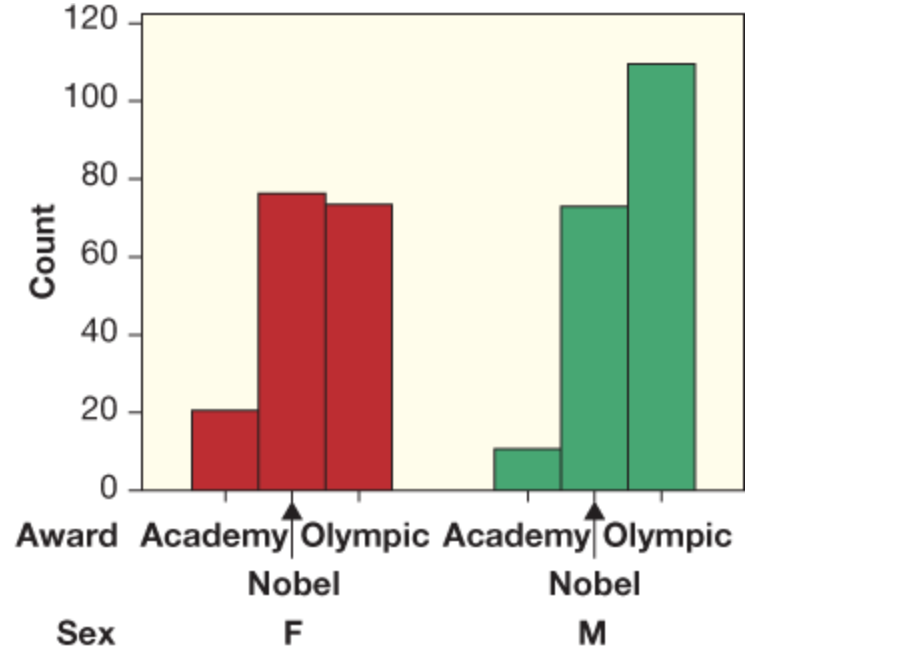
Comparative plots
What three questions do we consider when describing a single quantitative variable?
What is this?

Outlier
What type of graph is this?

Symmetric distribution
How would you describe this histogram's distribution?
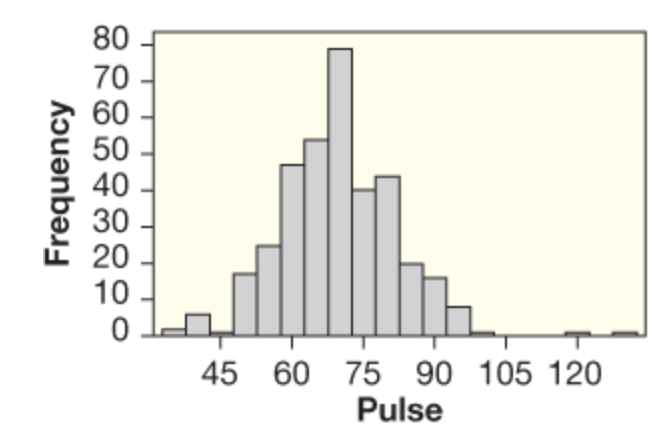
How would you describe these histograms' distribution?

How would you describe this distribution?
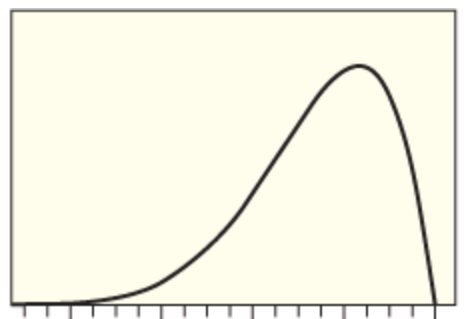
How would you describe this distribution?
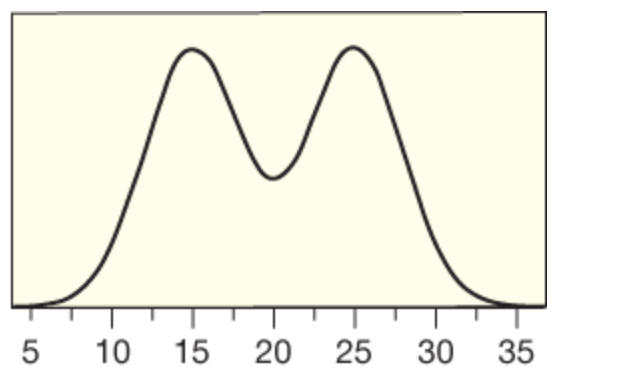
Mean
Notation for mean
sample / population
Median
Resistance
Is Mean <, >, or = to Median?

Is Mean <, >, or = to Median?
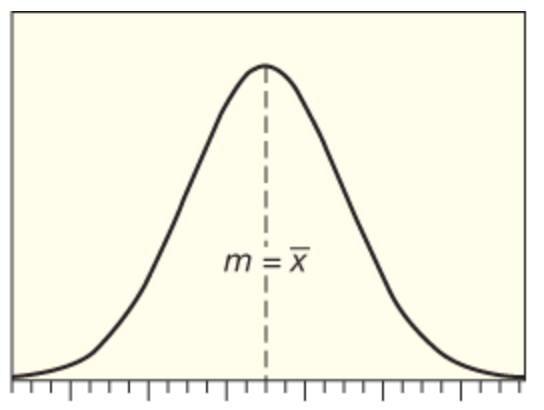
Is Mean <, >, or = to Median?

Standard deviation
Standard Deviation notation
sample
population
The 95% Rule
Z-score
P(th) Percentile
Five Number Summary
Range
Interquartile range (IQR)
Choosing measures of center & spread
boxplot
IQR method for detecting outliers

 Hide known cards